Container-native monitoring: peeling the onion
03/04/2018, by Peter Arijs
Container-native monitoring: peeling the onion
In a previous post, Justin Cook set the stage for container-native monitoring. In the past, I’ve also written various pieces on container monitoring on our own blog, but now I’d like to take a step back and discuss how and why we arrived at the need for container-native monitoring. Because the answer “when you use containers, you need container-specific monitoring” sounds more like a sales pitch and is not very substantive. Why is it that existing monitoring tools are so hard to plug in container environments, and what do these new “container-native” tools do different?
Full disclosure: I work for CoScale, a monitoring vendor that focuses on container environments, including Docker monitoring, Kubernetes monitoring and
OpenShift monitoring.
The old world
Let’s start by looking at how monitoring was done in “classical” environments, before containers were in fashion. In this case the applications run on classical servers or VMs and this part of the infrastructure is typically monitored by a server or infrastructure monitoring tool. Think Nagios, Zabbix, or something along those lines.
In a classical environment, we sometimes talk about “monolithic applications”, although these typically consist of multiple tiers, e.g. a load balancer, a web server, an application server and one or more database and caching components.
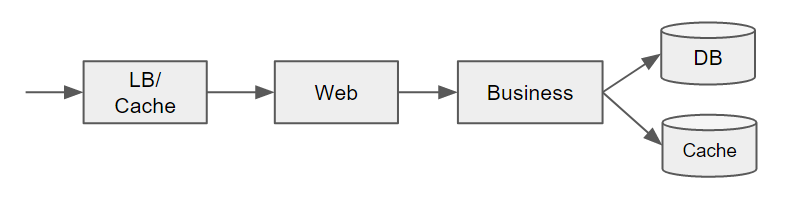
What makes these applications more monolithic is that the business logic in the application server is typically one large and integrated block, e.g. some Java code running on a Tomcat server. To gain insight in what is going on at the application level, APM (Application Performance Monitoring) tools were devised. At the expense of some extra overhead, they profile your application code using techniques such as byte code instrumentation, to gain visibility inside the call stack of your application.
Enter containers and microservices
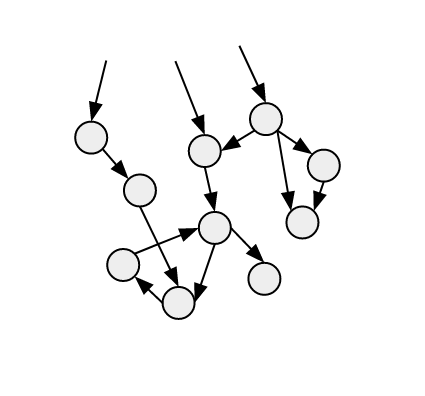
Of course you can containerize your classical application without any further changes, but typically containers go hand in hand with an evolution towards more microservice oriented architectures, where application logic is split up in smaller components, each running in their own container. The picture above now becomes a lot more complex, with for example the business logic component being split up in different smaller components that interact with each other.
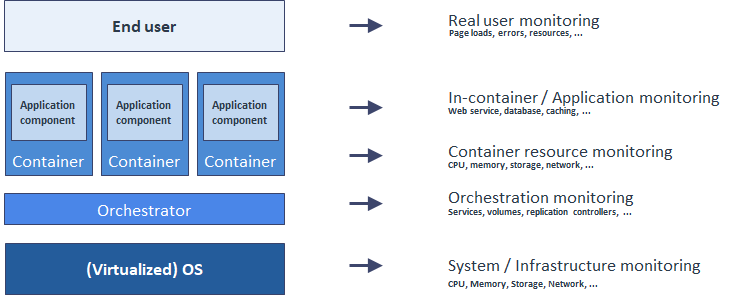
In such a scenario, classical server monitoring is still needed, but now you also need to monitor the individual containers. And these containers are being orchestrated and managed themselves, for example by Kubernetes, so we also need to monitor that layer to understand how containers are distributed over the different servers and which services they run. This is an aspect typically not covered by classical APM tools, but fundamental to obtaining the right visibility in a container environment.
Finally, what are these containers doing? It’s not enough to know what image or service a container is running, but also how the service inside is performing — and doing that in an efficient matter. This is where APM tools have difficulties, since they rely on an agent that needs to instrument every container, resulting in a lot of overhead and “modification” of the container image. So better and less intrusive techniques are needed that get relevant application metrics in a more lightweight manner, for example from log files, API’s, management interfaces, Prometheus endpoints, and so on.
So, with containers, monitoring becomes a stack with more layers to be monitored that in a classical environment as shown below.
Tracing
Of course, you can argue that APM tools still have value in such an environment, maybe not so much the instrumentation of the containers themselves (since there are other lightweight methods of doing so as we argued), but in understanding the interactions between different microservices. This part of the APM tooling is typically called “tracing” and works by injecting extra identification information in requests so that they can be stitched together to paint a picture of the interactions between the different microservices. This can help identifying problematic calls that are slowing down your application.

The recognition that distributed tracing is becoming an essential part for monitoring microservices has also fueled new initiatives, such as the OpenTracing or OpenCensus projects. Simplistically speaking, this is tracing without the byte code instrumentation of APM tools.
OpenTracing defines a tracing API (not an implementation!), and currently only a few of the newer microservices frameworks such as Dropwizard and Spring Boot support an implementation. For other applications, you need to define manual instrumentation. This is still a big difference compared to more automated but proprietary APM tools.
OpenCensus goes a step further in that it also provides some standard libraries for different languages. However these projects are evolving fast, and in particular OpenCensus is also supported by APM vendors, so we will likely see more automatic instrumentation capabilities going forward.
Bringing it all together
It’s certainly exciting times for container and microservices monitoring. So far, much of the effort has been on defining and gathering the appropriate data in several forms: metrics, logs, structured events, traces, etc. Equally (or even more) important is making sense of all this data, linking these different data sources together and providing valuable insights. This is where the real differentiation will be made in the market, where monitoring tools need to provide adapted visualizations, workflows and analytics to solve customer problems.


Facebook Comments